Clash Detection — Browser-Native, Zero Install¶
← Back to the User Guide · Home
Foundation: BIM_Designer_Browser.md | SQLite3D_Schema.md | ROADMAP.md | BIM_COBOL.md (CHECK CLASH verbs)
Version: 1.1 (2026-05-25)
Status: LIVE — storey-scoped progressive queries, discipline matrix, in-viewer review workflow
Depends on: measure.js, clash_rules.json, rtree-sql.js (WASM), Three.js
S278 Changes (2026-05-25)¶
- Clash pair colors: red
0xff0000+ blue0x2266ff(was red + orange) - Multi-select: Shift+Arrow keyboard selects range → solid red spheres at midpoints + fly-to bbox
- Matrix: query cache per discipline, offset reset on pair change
- Overlap mesh:
depthTest: false, shines through geometry - Refactor prompt:
prompts/S278_REFACTOR_CLASH_PANELS.md
1. The Problem with Desktop Clash Detection¶
Every BIM coordination meeting plays the same scene: someone opens Navisworks, runs a clash test, and the team stares at thousands of red dots with no context, no priority, and no way to act on them without switching tools.
| Pain Point | Navisworks / Solibri | BIM OOTB |
|---|---|---|
| Install | 8GB desktop app, Windows only | Zero — one browser tab |
| Cost | $3,570/yr (Navisworks) / $3,400/yr (Solibri) | Free |
| Clash review | Export HTML report, lose 3D context | In-viewer — click row, fly to clash |
| Tolerance | Set once, re-run entire test | Live slider — adjust and re-query instantly |
| Grouping | Manual (Navisworks) or basic (Solibri) | Storey-scoped — automatic, no N^2 explosion |
| Mobile | No (Navisworks/Solibri), partial (Revizto) | Yes — same URL, any device |
| Offline | Desktop only | Yes — PWA with cached DB |
2. The Technology¶
The same stack that powers the BIM OOTB browser viewer — sql.js (WASM SQLite with R-tree extension), Three.js (WebGL GPU rendering), and the BLOB-to-GPU pipeline where geometry goes straight from SQLite columns to the GPU with no intermediate file format. Full schema: SQLite3D_Schema.md.
Clash detection adds one query pattern: cross-join element_transforms scoped by storey and discipline, with bounding-box overlap arithmetic in the WHERE clause. The R-tree spatial index (built async at load time) enables future features like smart grouping and heatmap — constant-bounds lookups in O(log N).
3. How It Works¶
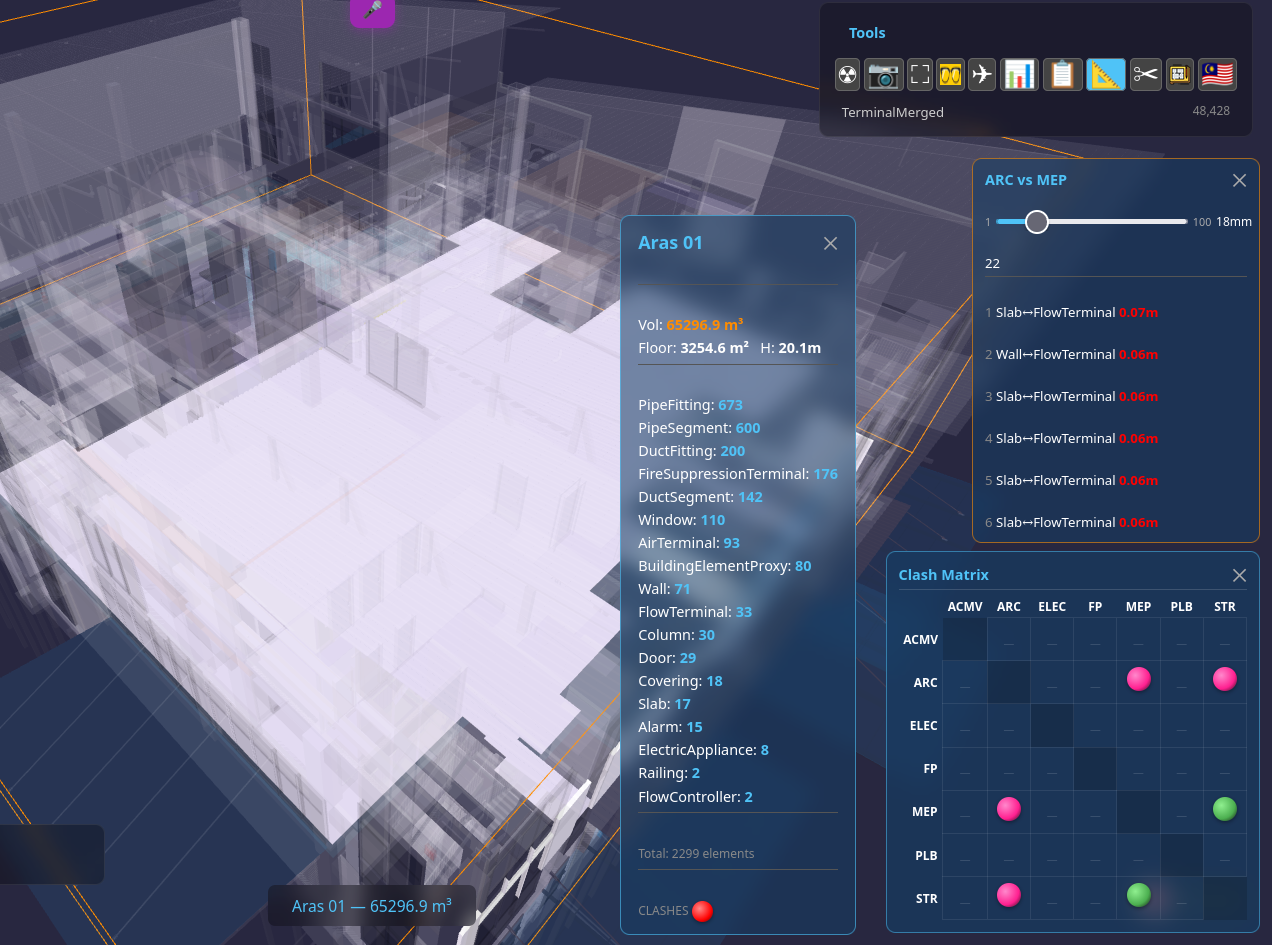
3.1 Right-Click: Info Card + Clash Sphere¶
Right-click any element to see its storey info card — element counts by IFC class, bounding box volume, floor area. At the bottom, a clash sphere lights up:
- Green — discipline envelopes don't overlap. Zero clashes guaranteed.
- Orange — envelopes overlap. Click to open the Clash Matrix.
Right-click empty space for whole-building analysis — same card, DB envelope instead of scene traversal (instant on any size building).
3.2 Clash Matrix — Discipline Grid¶
The matrix shows every discipline pair. Each cell is a sphere:
- Green = envelopes don't intersect — guaranteed clear
- Orange = envelopes overlap — clashes possible
- Red = hard clashes found (>50mm penetration)
- Dash = no rule defined for this pair
3.3 Cell Click: Storey-Scoped Queries¶
Click a matrix cell to query clashes for that discipline pair. The query strategy avoids the N^2 trap:
- Find shared storeys — two
GROUP BYqueries (instant) - Query first storey — cross-join scoped to one storey (200-4000 elements, fast)
- Show results immediately — user sees clashes in <500ms
- Load remaining storeys progressively —
setTimeoutyields between each storey query, results append to the list without blocking the UI - COUNT in background — lightweight
SELECT COUNT(*)per storey, total shown in header
User clicks cell
      |
      v
  Query storey list (2 GROUP BYs, instant)
      |
      v
  Query FIRST storey (LIMIT 30, <100ms)
      |
      v
  RENDER LIST  <-- user sees results here
      |
      +---> async: query storey 2 (setTimeout yield)
      +---> async: query storey 3 ...
      +---> async: COUNT per storey (header updates)
This architecture means a 48,000-element building with 7 disciplines never hangs the browser. Each storey query is scoped to a few hundred elements — the cross-join is O(n^2) but n is small.
3.4 Fly-To + Mesh Overlap Visualization¶
Click any clash row to fly the camera to the overlap zone. The viewer shows:
- Red mesh — clipped geometry of element A at the overlap
- Blue mesh — clipped geometry of element B
- Orange wireframe — bounding box of the storey
- Camera distance based on overlap size, not element bbox — tight framing on the actual clash
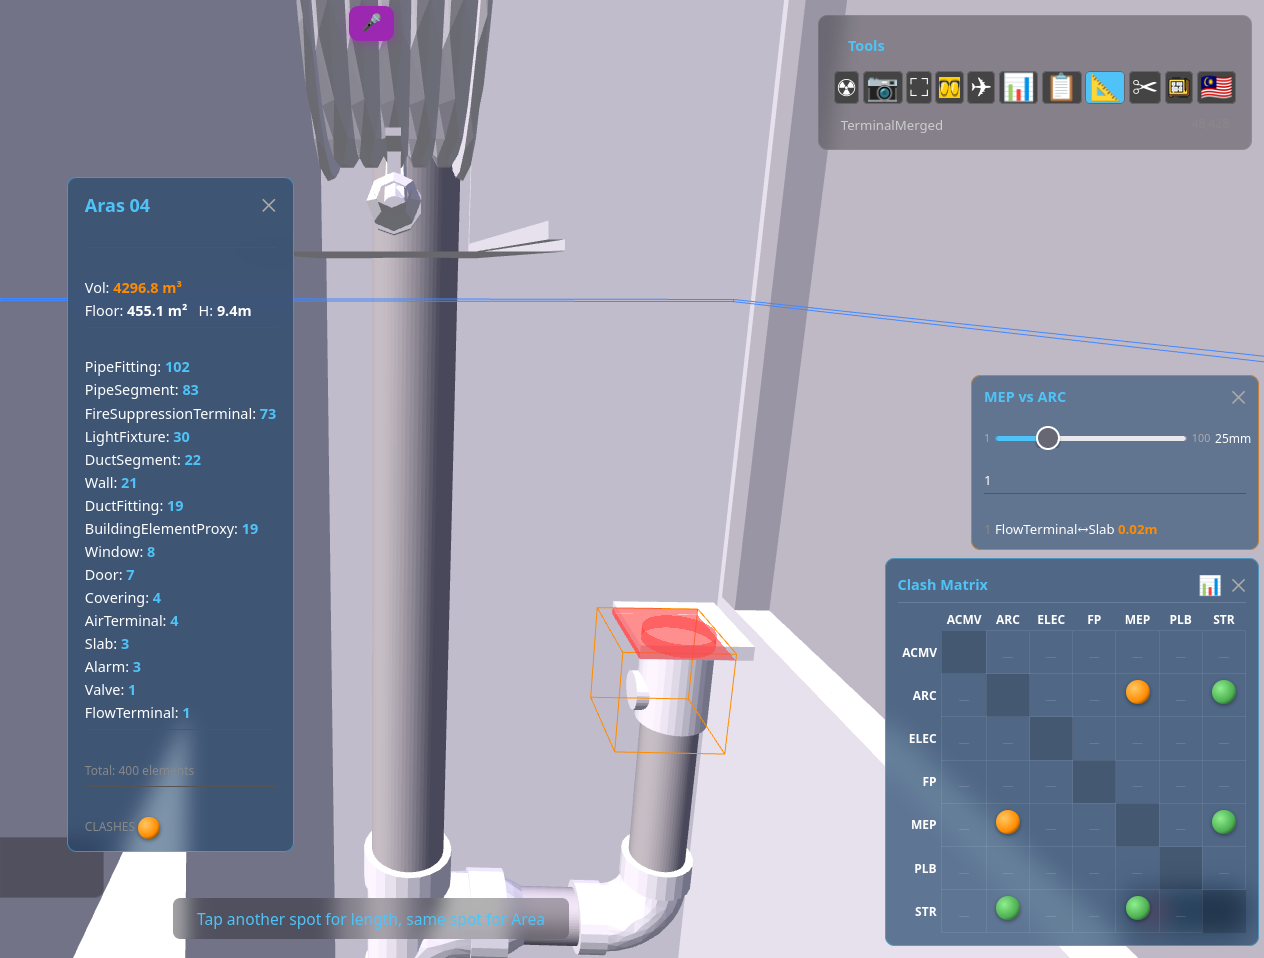
3.5 Live Tolerance Slider¶
Drag the slider (1mm to 100mm) and the query re-runs instantly with the new tolerance. No need to close a dialog, re-configure, and re-run the entire test — the feedback loop is sub-second.
3.6 In-Viewer Review Workflow¶
Right-click or long-press any clash row to cycle its status:
| Status | Icon | Meaning |
|---|---|---|
| (none) | Row number | New — not yet reviewed |
| Reviewed | Yellow circle | Acknowledged, under investigation |
| Resolved | Green circle | Fix applied, pending verification |
| Accepted | White circle | Intentional — no action needed |
Statuses persist in localStorage per building. No server, no login, no export/import cycle.
3.7 Shareable Clash Deep-Link¶
Click the share icon on any clash pair to copy a URL that encodes the full viewing state — building DB, clash pair GUIDs, camera position, target, tolerance, and storey filter. Anyone opening that link sees exactly the same clash, from the same angle, with the same settings. No login, no server, no app install.
Try it live: Open Clash Pair — Hospital Garage MEP vs ARC
URL anatomy:
?db=...HospitalGarage_extracted.db     ← SQLite DB source
#clash=GUID_A~GUID_B                   ← the two clashing elements
&st=                                   ← storey filter (empty = whole building)
&cam=-44.21,-8.22,-42.42               ← camera position (metres)
&tgt=-52.01,-7.95,-35.39               ← camera target (look-at point)
&tol=25                                ← tolerance in mm
This is collaboration via URL — one person finds a clash, shares the link, the recipient opens it and sees the exact same view. The URL is the coordination tool.
4. Clash Rules — JSON Configuration¶
Rules are defined in clash_rules.json — 12 discipline pairs with per-pair tolerance and ignore lists:
{
  "clash_rules": [
    {
      "name": "ARC vs STR",
      "source": { "discipline": "ARC" },
      "target": { "discipline": "STR" },
      "tolerance_m": 0.025,
      "ignore_classes": ["IfcOpeningElement", "IfcSpace", "IfcBuildingElementProxy"]
    },
    {
      "name": "MEP vs STR",
      "source": { "discipline": "MEP" },
      "target": { "discipline": "STR" },
      "tolerance_m": 0.050,
      "ignore_classes": ["IfcOpeningElement", "IfcSpace"]
    }
  ],
  "severity": {
    "hard":      { "min_overlap_m": 0.050, "color": "#ff0000", "label": "Hard clash" },
    "soft":      { "min_overlap_m": 0.010, "color": "#ff8c00", "label": "Soft clash" },
    "clearance": { "max_gap_m":     0.100, "color": "#ffff00", "label": "Clearance violation" }
  }
}
Currently 12 rules covering: ARC/STR, MEP/STR, MEP/ARC, ELEC/ARC, ELEC/STR, ELEC/MEP, FP/ARC, FP/STR, FP/MEP, ACMV/ARC, ACMV/STR, ACMV/MEP.
5. HTML Clash Report¶
Click the clipboard icon on the matrix to generate a full analytics report in a new tab:
The report includes:
- Matrix snapshot — the discipline grid as rendered at time of export
- 6 charts — severity distribution, status breakdown, discipline pair counts, IFC class pair frequency, radar overview, top offender elements
- Editable action sheet — assign responsibility, add notes, set due dates
- CSV export — one click to download for spreadsheet analysis
- Standalone — the entire report is one HTML file with embedded Chart.js. Email it, share it, open it offline.
6. Performance — 48K Elements, 7 Disciplines¶
Tested on Terminal (48,428 elements, 7 disciplines — the largest building in the test suite):
| Operation | Time | Technique |
|---|---|---|
| R-tree build | 1.2s | Async batches of 5000, setTimeout yields |
| Matrix background check | Instant | Discipline envelope overlap (one GROUP BY) |
| Cell click (first results) | <500ms | First storey only, LIMIT 30 |
| Remaining storeys | Progressive | One query per storey, async with UI yields |
| Total COUNT | Background | SELECT COUNT(*) per storey, no data columns |
| Fly-to camera | Instant | Camera distance from overlap size, not element bbox |
The key insight: never cross-join the whole building. Scope every query to a single storey (200-4000 elements) and the O(n^2) cross-join stays fast. The R-tree is built for future features (smart grouping, heatmap, clearance) where single-element lookups with constant bounds are the use case.
7. Architecture¶
Same architecture as the BIM OOTB viewer — one SQLite DB per building, WASM in the browser, BLOB geometry straight to GPU. Full schema: SQLite3D_Schema.md. The DB file is the deployment artifact — upload it to any static hosting and it works. No server, no API, no conversion.
8. Roadmap — What's Next¶
8.1 Smart Grouping (R-tree powered)¶
Cluster nearby clashes into groups using R-tree constant-bounds lookups: "Find all elements within 1m of this clash" — O(log N) per lookup. Show cluster count on matrix spheres instead of raw totals. Click cluster to expand.
8.2 Clash Heatmap¶
R-tree range query: count clashes per zone per storey. Colour-code the 3D model by clash density. Red zones = high concentration = prioritize. Requires only counting queries, no geometry.
8.3 Clearance Violation Detection¶
Expanded-bounds R-tree query: "Find elements within 5cm of this pipe." Already defined in clash_rules.json severity levels. Navisworks calls this "near miss" and requires a separate test setup — here it's a parameter change.
8.4 Trend Tracking¶
Store clash counts per discipline pair per date in localStorage. Show delta: "Last check: 45 clashes. Now 32." Progress visible across sessions without any server.
8.5 BCF Export¶
Industry-standard clash exchange format (BIM Collaboration Format, buildingSMART). A BCF file is a .bcfzip containing XML topics + optional PNG snapshots. One clash = one topic.
Why this matters: BCF is the only open standard for exchanging issues between BIM tools. A clash found in BIM OOTB becomes importable in Navisworks, Solibri, BIMcollab, Revit (via plugins), and Trimble Connect. Firms with mixed toolchains can use BIM OOTB for detection and hand off issues to their existing review workflow.
What BIM OOTB already has that maps to BCF:
| BCF Field | BIM OOTB Source |
|---|---|
Topic.Title |
Discipline pair + storey (e.g. "Structure–MEP clash, Level 2") |
Topic.Description |
Overlap distance, element names |
Topic.CreationDate |
Date.now() at export |
Topic.Priority |
Severity from clash_rules.json (Critical/Major/Minor) |
Topic.Status |
Review status from clash matrix (Review/Resolve/Accept) |
Viewpoint.Camera |
Current orbit camera position + direction + FOV |
Viewpoint.Components |
IFC GUIDs of both clashing elements |
Viewpoint.Snapshot |
Canvas screenshot (already built for snag/share) |
Implementation: Pure browser-side. Build XML strings, PNG from canvas, pack into a zip using JSZip (already a pattern in the Excel export). No server. Download triggers from the clash report "Export" button alongside the existing CSV option.
BCF version: BCF 2.1 (XML, widest tool support). BCF 3.0 (JSON) is newer but less widely imported.
8.6 Scene Sync from Report¶
Click a clash row in the HTML report and the 3D viewer (if open) flies to that clash via window.opener.postMessage. Report becomes a live navigation tool, not a dead PDF.
8.7 Storey Heatmap Bar Chart¶
Horizontal bar chart showing clash density per storey — storey-scoped counts are instant (already proven). Visual priority map: "Floor 3 has 120 clashes, Floor 7 has 4."
9. Files¶
| File | Role |
|---|---|
deploy/dev/measure.js |
Clash detection engine — queries, matrix, visualization, report |
deploy/dev/clash_rules.json |
12 discipline-pair rules with tolerances |
deploy/dev/loader.js |
CDN reference for rtree-sql.js@1.7.0 WASM |
deploy/dev/sw.js |
Service worker cache for WASM + DB files |
10. Try It¶
Open the BIM OOTB viewer, load any multi-discipline building (Terminal recommended), activate the Measure tool, right-click any element or empty space, and click the clash sphere.
No install. No sign-up. No server. Just a browser.
11. Mode Exclusion — Clash vs Cascade Colors¶
Clash review colors (red/blue for clash pairs, orange for envelope overlap, green for clear) and RS drag cascade colors (BOM_ENGINE_SPEC.md §22) share the same palette but carry different meanings. They never co-exist:
| Mode | Active when | Colors mean |
|---|---|---|
| Clash review | Measure tool → clash sphere → matrix open | Red=element A overlap, Blue=element B overlap, Orange=envelope overlap, Green=clear |
| RS drag | RS line has focus, user is dragging | Green=original extent, Blue=new area, Orange=being removed, Red=clash zone (informational) |
Rule: RS drag mode disables clash overlay. Clash mode disables drag colors. If the user switches between modes, colors reset and reapply for the new mode.
Clash during drag: Red clash highlighting CAN appear during RS drag — it marks overlap zones where two elements now intersect. This is informational, not a gate. The user may intend to fix the overlap in a subsequent operation. Only structural invariant failures (adjacency, coverage) block the drag via the red-line gate (BOM_ENGINE_SPEC.md §22.5).